JS Tutorial
JS Version
JS Objects
JS Function
JS Classes
JS Async
JS HTML DOM
JS Browser BOM
JS Web API
JS AJAX
JS JSON
JS vs JQUERY
JS Graphics
JS Google Chart
How to Use Google Chart?
Use the Google Chart on your web page, add a link to the charts loader:
<script src=”https://www.gstatic.com/charts/loader.js”></script>
Google Chart is easy to use.
Just add a <div> element to display the chart:
<div id=”myChart” style=”max-width:700px; height:400px”></div>
The <div> element must have a unique id.
Load the Google Graph API:
Load the Visualization API and the corechart package
Set a callback function to call when the API is loaded
- google.charts.load(‘current’,{packages:[‘corechart’]});
- google.charts.setOnLoadCallback(drawChart);
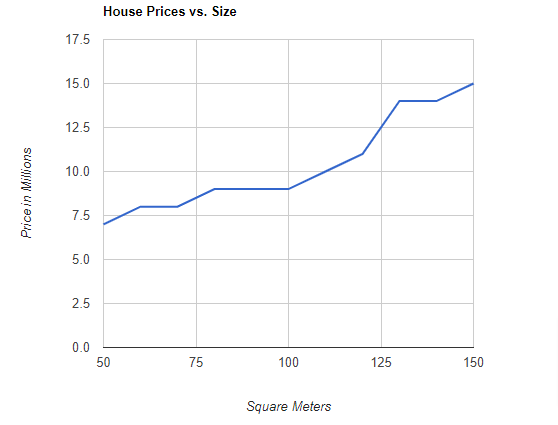
Line Graph
Example
<!DOCTYPE html>
<html>
<script type=”text/javascript” src=”https://www.gstatic.com/charts/loader.js”></script>
<body>
<div id=”myChart” style=”width:100%; max-width:600px; height:500px;”></div>
<script>
google.charts.load(‘current’,{packages:[‘corechart’]});
google.charts.setOnLoadCallback(drawChart);
function drawChart() {
// Set Data
var data = google.visualization.arrayToDataTable([
[‘Price’, ‘Size’],
[50,7],[60,8],[70,8],[80,9],[90,9],
[100,9],[110,10],[120,11],
[130,14],[140,14],[150,15]
]);
// Set Options
var options = {
title: ‘House Prices vs. Size’,
hAxis: {title: ‘Square Meters’},
vAxis: {title: ‘Price in Millions’},
legend: ‘none’
};
// Draw
var chart = new google.visualization.LineChart(document.getElementById(‘myChart’));
chart.draw(data, options);
}
</script>
</body>
</html>
Output
Scatter Plots
To scatter plot the same data, change google. visualization to ScatterChart:
Example
<!DOCTYPE html>
<html>
<script type=”text/javascript” src=”https://www.gstatic.com/charts/loader.js”></script>
<body>
<div id=”myChart” style=”width:100%; max-width:600px; height:500px;”></div>
<script>
google.charts.load(‘current’, {‘packages’:[‘corechart’]});
google.charts.setOnLoadCallback(drawChart);
function drawChart() {
var data = google.visualization.arrayToDataTable([
[‘Contry’, ‘Mhl’],
[‘Italy’,55],
[‘France’,49],
[‘Spain’,44],
[‘USA’,24],
[‘Argentina’,15]
]);
var options = {
title:’World Wide Wine Production’
};
var chart = new google.visualization.BarChart(document.getElementById(‘myChart’));
chart.draw(data, options);
}
</script>
</body>
Output
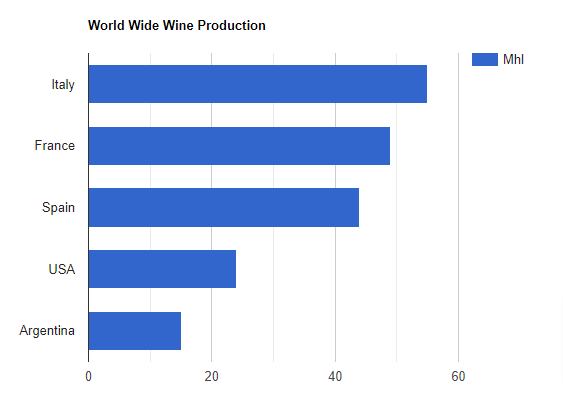
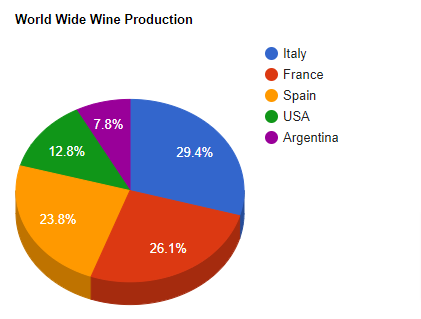
Pie Charts
To convert a Bar Chart to a Pie chart, just replace:
google.visualization.BarChart with google.visualization.PieChart
Example
<!DOCTYPE html>
<html>
<script type=”text/javascript” src=”https://www.gstatic.com/charts/loader.js”></script>
<body>
<div
id=”myChart” style=”width:100%; max-width:600px; height:500px;”>
</div>
<script>
google.charts.load(‘current’, {‘packages’:[‘corechart’]});
google.charts.setOnLoadCallback(drawChart);
function drawChart() {
var data = google.visualization.arrayToDataTable([
[‘Contry’, ‘Mhl’],
[‘Italy’,54.8],
[‘France’,48.6],
[‘Spain’,44.4],
[‘USA’,23.9],
[‘Argentina’,14.5]
]);
var options = {
title:’World Wide Wine Production’
};
var chart = new google.visualization.PieChart(document.getElementById(‘myChart’));
chart.draw(data, options);
}
</script>
</body>
</html>
Output
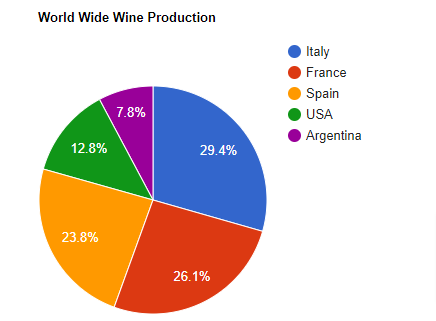
3D Pie
To display the Pie in 3D, just add is3D: true to the options:
var options = {
Example
<!DOCTYPE html>
<html>
<script type=”text/javascript” src=”https://www.gstatic.com/charts/loader.js”></script>
<body>
<div
id=”myChart” style=”width:100%; max-width:600px; height:500px;”>
</div>
<script>
google.charts.load(‘current’, {‘packages’:[‘corechart’]});
google.charts.setOnLoadCallback(drawChart);
function drawChart() {
var data = google.visualization.arrayToDataTable([
[‘Contry’, ‘Mhl’],
[‘Italy’,54.8],
[‘France’,48.6],
[‘Spain’,44.4],
[‘USA’,23.9],
[‘Argentina’,14.5]
]);
var options = {
title:’World Wide Wine Production’,
is3D:true
};
var chart = new google.visualization.PieChart(document.getElementById(‘myChart’));
chart.draw(data, options);
}
</script>
</body>
</html>
Output