JS Tutorial
JS Version
JS Objects
JS Function
JS Classes
JS Async
JS HTML DOM
JS Browser BOM
JS Web API
JS AJAX
JS JSON
JS vs JQUERY
JS Graphics
JS Canvas
HTML Canvas works well for Scatter Plot
HTML Canvas works well for Line Graph
HTML Canvas works perfect for combining Scatter and Lines
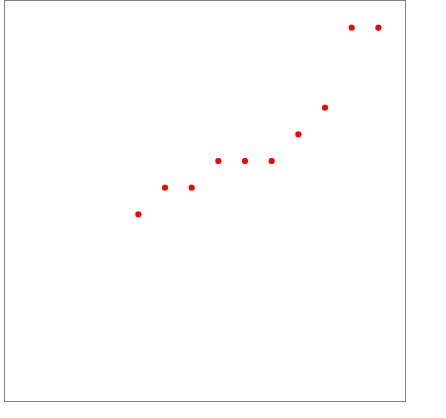
Scatter Plots
Example
<!DOCTYPE html>
<html>
<body>
<canvas id=”myCanvas” width=”400″ height=”400″ style=”border:1px solid grey”></canvas>
<script>
const canvas = document.getElementById(“myCanvas”);
const ctx = canvas.getContext(“2d”);
canvas.height = canvas.width;
ctx.transform(1, 0, 0, -1, 0, canvas.height)
const xArray = [50,60,70,80,90,100,110,120,130,140,150];
const yArray = [7,8,8,9,9,9,10,11,14,14,15];
ctx.fillStyle = “red”;
for (let i = 0; i < xArray.length-1; i++) {
let x = xArray[i]*400/150;
let y = yArray[i]*400/15;
ctx.beginPath();
ctx.ellipse(x, y, 3, 3, 0, 0, Math.PI * 2);
ctx.fill();
}
</script>
</body>
</html>
Output
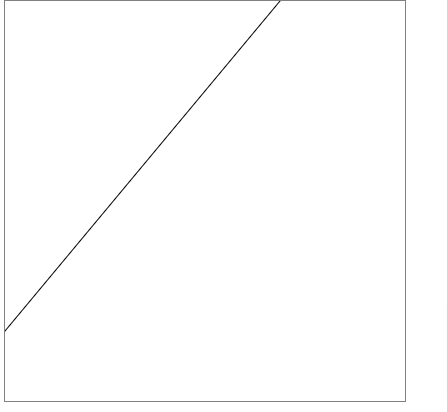
Line Graphs
Example
<!DOCTYPE html>
<html>
<body>
<canvas id=”myCanvas” width=”400″ height=”400″ style=”border:1px solid grey”></canvas>
<script>
const canvas = document.getElementById(“myCanvas”);
const ctx = canvas.getContext(“2d”);
ctx.fillStyle = “#FF0000”;
canvas.height = canvas.width;
ctx.transform(1, 0, 0, -1, 0, canvas.height)
let xMax = canvas.height;
let slope = 1.2;
let intercept = 70;
ctx.moveTo(0, intercept);
ctx.lineTo(xMax, f(xMax));
ctx.strokeStyle = “black”;
ctx.stroke();
function f(x) {
return x * slope + intercept;
}
</script>
</body>
</html>
Output